|
Climate
Change, Sunspot
Activity
&
Lunar/Cosmic
Cycles
INTRODUCTION
Kevin Long believes that the
profound climate-changing influences of SUNSPOT
ACTIVITIES and LUNAR/COSMIC
CYCLES have not been
recognised by most climate commentators who generally follow the
misguided conclusions of the
IPCC (Intergovernmental Panel
on Climate Change).
Australia's
Bureau of Meteorology is among the organisations to ignore
these factors in its climate predictions. (See Bureau discussion below.)
KEY EFFECTS
There
is much evidence (including graphs
and references
below)
to suggest that the currently diminishing SUNSPOT
ACTIVITY is
likely to produce a cooling trend rather than a warming trend during
the next few decades.
Divergence of global
temperatures from IPCC predictions indicates that we are
facing
Global Cooling
... not Global
Warming!
The LUNAR/COSMIC
CYCLES
also have a direct bearing on rainfall peaks and
atmospheric conditions. The predominant lunar cycle is an 18.6 year
flood cycle, which is enhanced by the 19.86 year Jupiter/Saturn cycle.
Observation of such cycles greatly increases
the accuracy of rainfall predictions. See explanatory document
and references
below.
| COSMIC FINGERPRINTS IN
RAINFALL RECORDS OF VICTORIA AND QUEENSLAND |
When the sunspot and
lunar
cycles coincide there are distinct rainfall peaks. The 18.6 year Lunar
cycle created flood years in Central Victoria in 1954-6,
1973-5, 1992-3 and 2010-11
The 2010-11 floods in northern Australia reflected a peak lunar
rain-enhancement cycle. This particular lunar cycle was strongly
enhanced by the closely synchronised 19.86 year
Jupiter-Saturn Synodic Cycle. |


 |
SUNSPOTS - THE
GENERAL RULE
The general
rule of thumb that should
be observed is that :
MORE
SUNSPOTS =
HIGHER TEMPERATURES = MORE RAIN
and
conversely ...
FEWER SUNSPOTS = LOWER TEMPERATURES = LESS RAIN
(
NOTE:
There
appears to be an approximate 20-year time lag for sunspot heat captured
in the oceans to manifest in global temperature changes. Kevin
is
assembling graphical data on this
topic at present and invites correspondence on the subject CONTACT
KEVIN
)
ARGUMENT THAT SUNSPOT
ACTIVITY
IS THE DOMINANT CLIMATE DRIVER
OVER
CO²
Sunspot
activity during
the
20th Century was at its highest for 8,000 years (See Solanki paper below)
This drove
global
temperature averages up to the highest peak in 1998.
(See Global
Temperature
graph below)
Average
sunspot
activity has
been declining
for over 30 years.
(See Sunspot
Activity
graph from Abdussamatov below)
We now see temperatures
declining in response to this drop in sunspots, which takes into
account a time lag of approximately 20 years.
The current
and future
sunspot cycles are predicted to weaken further, which points to global
cooling rather than warming.
(See NASA graph
and other
science references below)
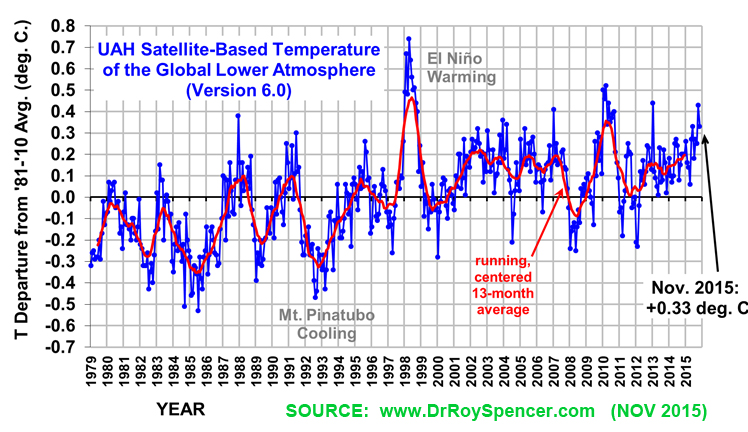
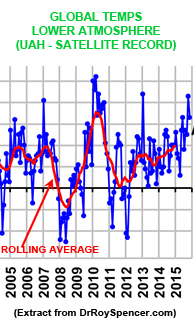
GLOBAL
TEMPERATURE GRAPH
Graph taken from
www.DrRoySpencer.com (Nov
2015)
For updates to this graph and
Spencer's discussion go
HERE
Since
the 20th Century
global temparature peak in the 1998 El Nino year, there has
been a
clear divergence between the predictions of the IPCC computer models
and the actual temperature records.
The
IPCC has fudged its data set of
temperatures (changing from "HadCRUT 3" to "HadCRUT 4") in an attempt
to hide this divergence with "homogenised" data. However the IPCC has
succeeded only in destroying any meaningful ability to compare
long-term temperature records, underlined by the fact that the more
reliable ("non-homogenised") HadCRUT3 dataset was
discontinued in
2014 .... essentially a culpable act.
The most precise and simple dataset for global temperature in the
modern era is the SATELLITE RECORD OF
LOWER ATMOSPHERE TEMPERATURES
compiled by Dr Roy Spence of the
University of Alabama. (See his LINK
for full discussion of the methodology and
regular updates of this dataset).
The IPCC argument states that CO² levels are the main driver
of
temperature rise. Consequently, all of the IPCC's computer models show
a
continuing
rise in temperature due to increased CO² ... and they
provide
no scenario to
explain the current trend of temperature divergence.
There
is
obviously
something other than CO² levels dominating
the global
climate. Scientific data clearly shows that "decline in
sunspot
activity" produced the Little Ice Age in the period prior to 1700.
However
the IPCC does not give true weight to the role of sunspot activity as a
major driver of global climate.
Hence
the only true "climate feedback
loop" that is really operating is the PR cycle of the IPCC - driven by
the fatally flawed computer models and a complicit mega-bureacracy.
Here
is the RELIABLE
satellite
temperature record .......
(
NO FUDGING!!
)
|
SUNSPOT HISTORY GRAPH
Graph
taken from "The
Sun Defines the
Climate"
by Abdussamatov (2009)
The
20th Century saw the highest level of sunspot activity - peaking in the
mid-1950's (tallest red peak). The weakening of sunspot activity since
the 1970's has been predicted to continue over the next three sunspot
cycles
(shaded in blue).
The author equates this to a New Little Ice Age expected to begin
around 2042.
This would be similar to the Little Ice Age prior to 1700 which
coincided with the low sunspot activity period known as the "Maunder
Minimum".

|
SUNSPOT PREDICTION GRAPH
by NASA
NASA
is predicting significantly weaker Sunspot Activity
for
the current Sunspot Cycle (No 24).
This is likely to produce cooler temperatures and lower rainfall.

|
|
Is
the Bureau of Meteorology
"asleep
at the wheel" regarding
sunspot
influence on climate ???
Despite significant
scientific evidence (below), neither of the major
climate-changing
factors of SUNSPOT ACTIVITY
or LUNAR
CYCLES
appear
to be considered by the Bureau of Meteorology in their short-term or
long-term weather predictions for Australia!
It would seem that the Bureau has blindly followed the lead of the IPCC
in discounting the influence of sunspots and solar variation ... to the
enormous detriment of Australia's future climate predictions.
On the topic of sunspots, the Bureau says in its Frequently
Asked
Questions:
Q:
Is there a link between sunspot activity and the weather?
A: The
Bureau of Meteorology does not currently track sunspots. Information
can be found ...
by searching the Internet for 'sunspots'. |
Also, the Bureau states in the on-line document "Greenhouse Effect
& Climate Change"
p12
There
have been attempts to explain the global temperature trends of the past
century in terms of sunspot-based measures of solar activity.
Some correlation is evident between average sunspot numbers and
temperature trends (Figure 18)
and
correlation has been identified between the length of the sunspot cycle
and northern hemisphere mean temperature anomalies.
At this stage, in the
absence of identified causal linkages, this finding has not generally
been accepted by the scientific community
as having any
real significance as the ‘explanation’ for the
pattern of temperature changes over the last century.
Although this is an area where much more has yet
to
be learned, the
direct solar forcing of climate by variations in solar radiation, and
the indirect solar forcing via solar-related changes in atmospheric
ozone, need to be considered in determining the future variations of
global climate. |
How can
the Bureau of Meterology and other organisations such as the CSIRO be
trusted to interpret Australia's climate future?
At what point does Australia officially say ...
"Maybe the IPCC got
it wrong" ?
|
REFERENCES AND LINKS
The following resources are recommended for those wishing to learn more
on the subject of Sunspots, Solar Variation and Lunar Cycles :
More information and
links will be added to this page over time.

Sign
up here
for "The Long View" email list.
|
|

BACK TO
HOME
PAGE
THE
IPCC DATASET IS
CORRUPT !
SEE THE
TRUE GLOBAL TEMPERATURE AND DISCUSSION
LOWER ON THIS PAGE
|
NASA points to
a weak
Sunspot Cycle ... another indication of Global Cooling

SEE LARGE GRAPH AND DISCUSSION
BELOW
|
|