SUBJECT:
|
COMMENT: |
WEBSITE RUN BY: |
| |
|
|
|
WEATHER
DEFINITIONS |
| Glossary
of
Meteorology |
|
Bureau
of Meteorology
BOM
(AUS government) |
|
|
|
|
|
|
|
NATIONAL
WEATHER |
| Bureau
of Meteorology - Home Page |
Capital
city daily forecasts, BOM Index |
BOM
(AUS government) |
| Current
Satellite Animation of Australian Weather |
Select
"Colour Infrared Loop" |
BOM
(AUS government) |
| Current
Radar Images - Individual Cities and Regions |
Click
city. Select radar image radius from 64-512km. Tick "weather
observations" to see current real-time wind and rainfall readings. |
BOM
(AUS government) |
| All
Forecasts - State by
State |
VIC
NSW
QLD
SA
WA
TAS
NT |
BOM
(AUS government) |
| 7-day
Forecast - Australia (by WEATHERZONE) |
Good
clear explanations and colour. Click maps for larger size.
Especially good view of current JETSTREAMS
(see white arrow on maps) |
Weatherzone.com.au |
| 10-Day
Precipitation Outlook for Australia |
|
BOM
(AUS government) |
| |
|
|
|
TOWN-BY-TOWN
WEATHER OBSERVATIONS |
| |
For
daily, monthly and annual weather observations, select your town in the
index of each state:
|
|
| |
VIC
NSW
QLD
SA
WA
TAS
NT
|
|
| |
|
|
|
NATIONAL
WEATHER --- DETAILED TECHNICAL
CHARTS |
| AUSTRALIA
- 5 day forecast - Air
Pressure and Rainfall |
|
|
|
|
|
| GLOBAL
- 5 day forecast - Air
Pressure and Rainfall |
|
|
|
|
|
| SOUTHERN
HEMISPHERE
- 5 day forecast - Air
Pressure and Rainfall |
|
|
|
|
|
| Recent
S.O.I. Values
(Southern Oscillation Index) |
|
QLD
government |
|
|
|
| Current
MJO Chart (Madden Julian Oscillation) |
|
BOM
(AUS government) |
|
|
|
| |
|
|
| CENTRAL
VICTORIAN WEATHER |
|
|
|
|
| ABC
Victorian Weather |
|
ABC
(AUS government) |
| Victoria - Town by town - 7 day
Forecast |
|
BOM
(AUS government) |
| BOM
Daily Rainfall Bulletin - VIC |
|
BOM
(Aus Government) |
| Bendigo, Vic - Daily
Weather
Observations |
|
BOM
(Aus Government) |
| |
|
|
COSMIC
AND PLANETARY
INFLUENCES
|
|
|
|
Where
is
THE
SUN
or
THE
MOON right now? |
Shows
view of the Earth from the
Sun or Moon's current position.
(Select the button for either Sun or Moon)
THE
MOON BEING
OVERHEAD
INCREASES THE CHANCE OF RAIN
DUE TO THE LUNAR
ATMOSPHERIC TIDE EFFECT. |
  |
| Current positions of Planets
|
Recommended
that you select "Equal" in
the Orbit section for clearest view.
For the key to the planetary
symbols see HERE.
|
 
|
| Software
for positions of Planets |
SimSolar
v2.0
Simple free software to generate planet views. Includes option to
scroll through and view in motion.
QUICK TOUR
or FREE
DOWNLOAD |
 |
|
|
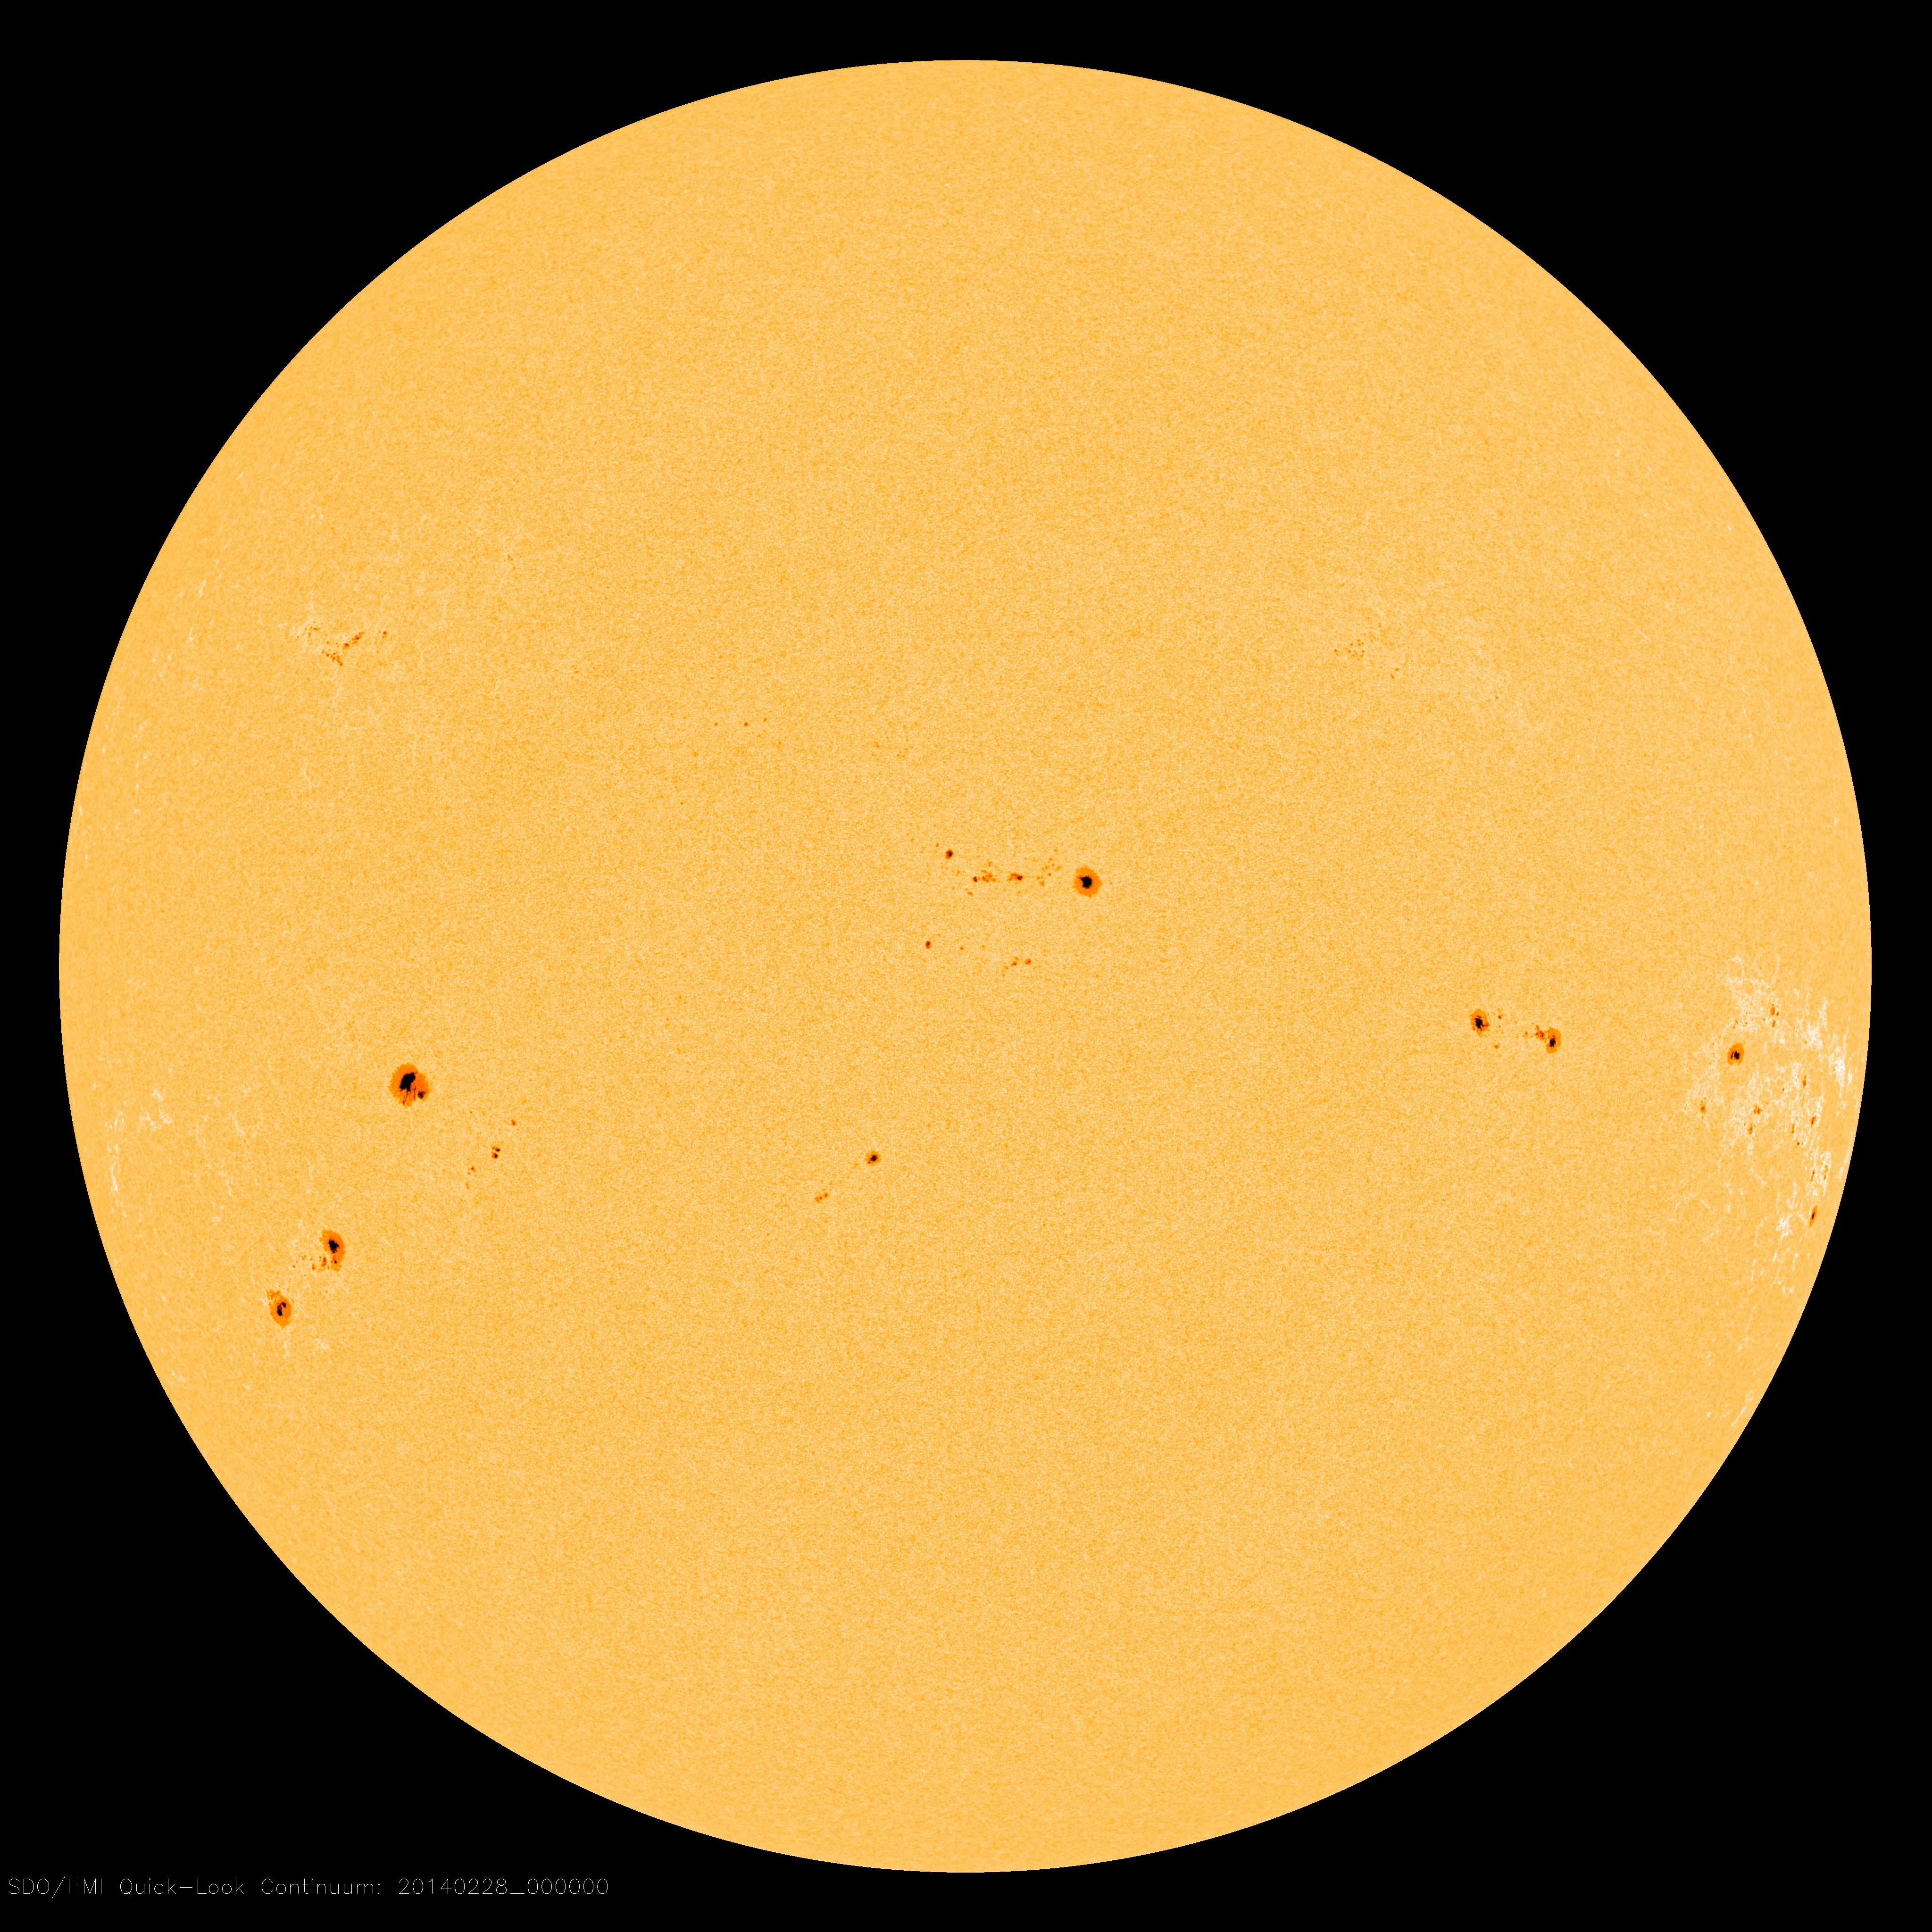
Daily
monitoring
of current
sunspot activity counts.
Click image at right for current full screen image. |
 |
| |
|
|
GLOBAL
CLIMATE DATA
|
|
|
|
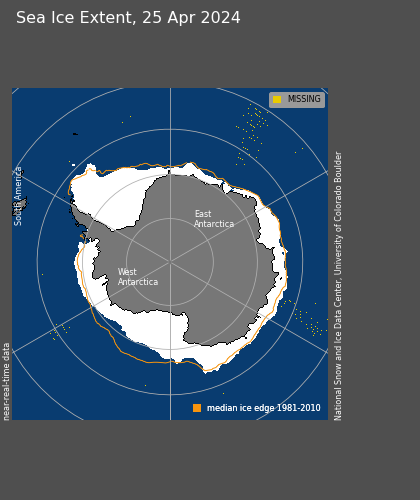
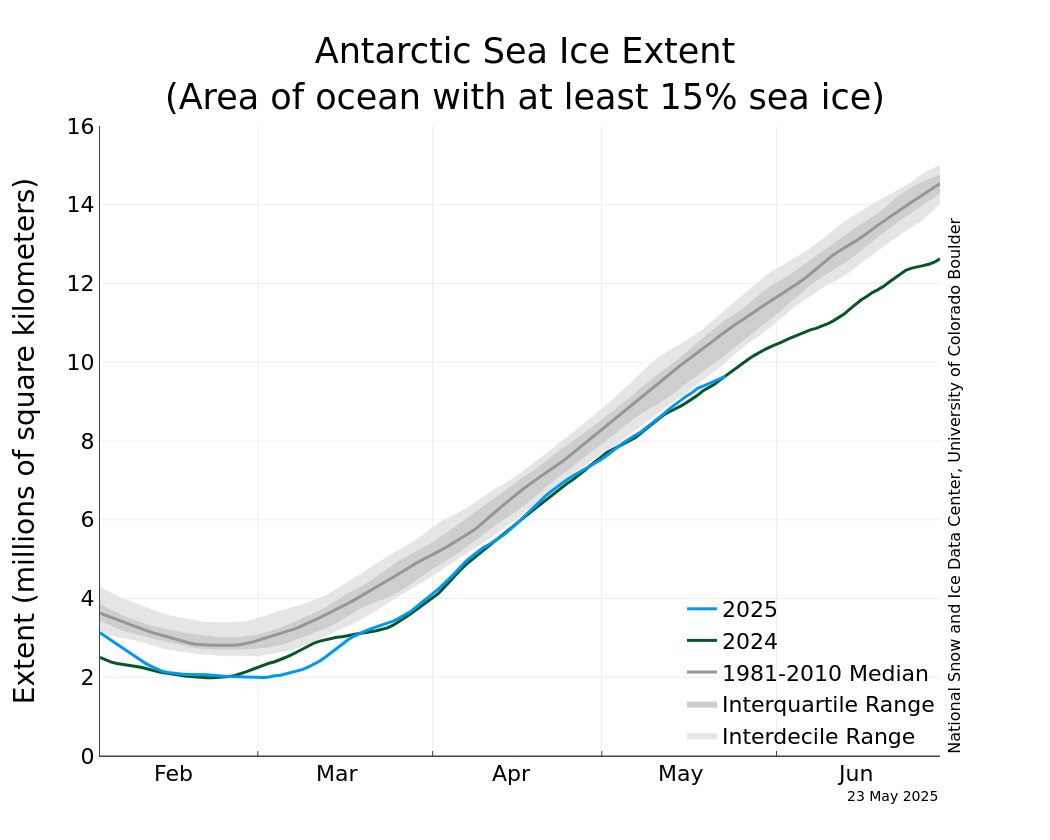
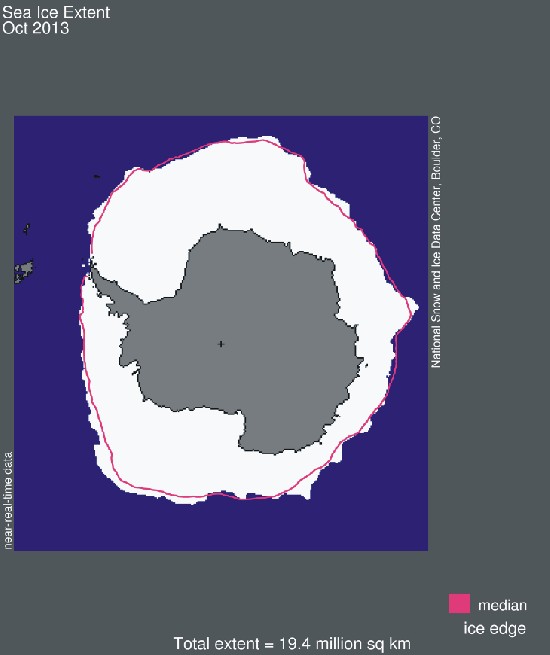
Antarctic
Daily
Ice Images
|
Southern
Hemisphere sea ice data updated daily, with one-day lag. The
graph also includes lines for selected earlier years, for comparison. |
|
"Climate
4 You"
Latest Scientific Data ... including
GLOBAL
SEA ICE |
An
excellent compilation of the latest scientific measurements :
- global air and ocean temperatures
- Sea ice coverage
- Snow cover
- Sunspots
- Greenhouse gases
|
Data
from various agencies, compiled
by Danish academic Ole Humlum
|
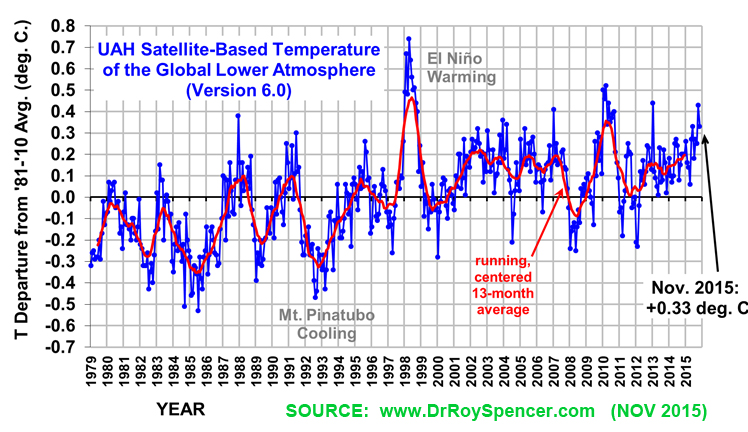
Global
Average Temperatures --
(Lower
Atmosphere
-
UAH Satellite) |
The
best dataset for "untampered" measurements of global temperature.
Compiled from satellite data. |
Dr
Roy
Spencer, University of Alabama.
|
Official
"Global Average Temperatures"
from
IPCC source (incl. HadCRUT4 dataset) |
WARNING:
Contains homogenised "tampered" data.
This is the latest
"official" global temperature dataset (including cumulative average for
current year), as used by the UN's Intergovernmental
Panel on Climate Change.
Scroll down to select your preferred dataset.
Shortcut to graph
of global average temperatures
Shortcut to HadCRUT3 Global Average Temp data file
(shows monthly average with annual average in right hand column ...
1850-present) |
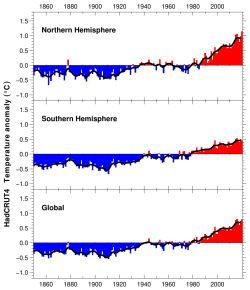
Hadley
Centre of the Met Office (UK) in conjunction with NASA |
|
|
|
| Global
"Sea
Surface Temperature Anomalies" (SSTA) |
Shows
current state of "El Nino" and
warm/cold
water anomalies.
CURRENT
--->
ARCHIVE
On
the archive page, scroll down to " Archived
Data and Images".
Then,
under
"Sea Surface Temperature (CoralTemp) Images"
go to first drop
down menu and select "Global".
Then select date in other drop-down.
|
NOAA
- National Oceanographic and Atmospheric Administration -
(US
Dept of Commerce)
|
|
|
|
|
|
|
|
|
|
|
WATER
RESOURCES MANAGEMENT: |
|
NOTE:
There are
many water
corporations and water management agencies.
Below are
just a
few
relevant to
Central Victoria.
|
| Coliban Water - Reservoir
Levels |
|
A Water
Corporation
estab. by VIC Govt -
area includes Central Victoria |
|
|
|
| Goulburn-Murray
Water - Reservoir Levels |
|
A Water
Corporation
estab. by VIC Govt -
area includes Central Victoria |
| |
|
|
| Murray
Darling
Basin Authority (MDBA) |
Includes
regular national
"Drought Updates"
covering national water security and strategies. |
Authority
established by AUS
Govt |


